 PC
PC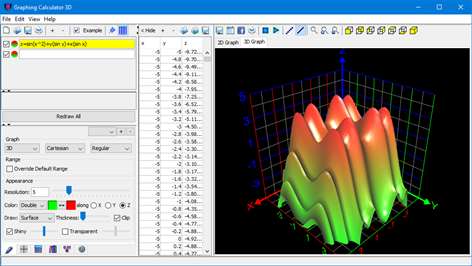

Information
English (United States)
Description
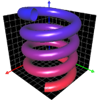
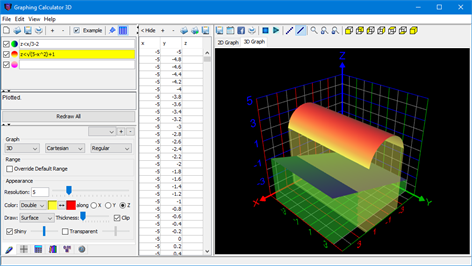
Plot high quality graphs of mathematical equations and data with this easy-to-use software. To plot a function simply type it down and the graph will be updated instantly after each keystroke. Its rich set of features include:
- Plot 2D & 3D functions - Plot implicit equations - Plot parametric equations - Plot inequalities - Plot 3D scatter points - Plot contour graphs - Generate tables of values - Cartesian coordinates - Polar coordinates - Cylindrical coordinates - Spherical coordinates - Import csv & excel coordinates - Import live data coordinates - High precision computations - 3D shading & glass effects - Fast rotation & graph animations - Simultaneous multiple graphs - Define your own variables - Change value of variables via sliders and see their effects on graphs - Define your own functions (including recursive functions) - Save graphs as high-resolution images - Animate graphs
Free Edition Limitations:
- Cannot save or open files - Maximum 5 simultaneous graphs - Limited resolution and computational precision
People also like
Reviews
-
3/26/2017Powerful, but the UI is limited and frustrating by Andrew
Far more powerful and useful than other graphing applications without the complexity or tedium of a full-on mathematical suite. You can define parameters/variables and their ranges and see how your system behaves with different parameter values. It's pretty much as easy as typing in the formulas and see it render. The software also generates tables of values for the function. However, the interface is unintuitive and has limitations and glitches that make the experience frustrating. Why can't I use R as a variable? Why is it that when I've clearly declared a variable, the formula that uses it says I haven't? Why is it so tedious to change graph parameters? It would also be helpful to be able to annotate elements of the graph to keep track of their interpretations and also for key points such as inflection points.. There also doesn't appear to be any way to automatically discover inflection points and intercepts. This along with annotation would be a big help.
-
11/20/2017excellent graphing utility by Robert
I like it all. I wish there was a way to create volumes of revolutions
-
1/29/2018amazing by evan
it is so fun to mess around on It even helped me with my math work
Articles
Top downloads
- 1
Duolingo - Learn Languages for Free
Free
- 2
T-Translator
Free
- 3
Optical Illusions
Free
- 4
VoiceTranslator
Free
- 5
My Study Life
Free


New and rising apps
- 1
Driving Theory Test
$4.49
- 2
Hazard Perception Test UK
$2.49
- 3
Driving Theory Test UK
$1.99
- 4
1 Learn Sight Read Music Notes - Solfa
$1.49
- 5
German - Czech
$1.79
- 6
CorelDRAW Graphics Suite X7 Tutorials
$1.99
- 7
World Atlas & Quiz MxGeo Pro
$2.49
- 8
German English dictionary ProDict
$2.99
- 9
Zulu English dictionary ProDict
$2.99
- 10
Deutsche Gedichte
$0.99


Best-rated apps
- 1
Chestionare auto - Scoala Auto
$1.49
- 2
DK Print your own T. Rex
Free
- 3
Learn Spanish
$11.99
- 4
Kent Hovind Seminars
Free
- 5
MakeCode for micro:bit
Free
- 6
Snap + Core First Full
$179.99
- 7
Bulgarian - English
$1.79
- 8
Guitar Chord Groups
Free
- 9
Root Solver
Free
- 10
Snap + Core First
Free


Best-rated games
- 1
Sudoku Play & Solve
$0.99
- 2
BoxEmoji
Free
- 3
Drift Mania Championship
$0.99
- 4
Ball don't fall
$1.99
- 5
Hidden Object : Film Ready Action
$1.99
- 6
2 Pics 1 Word - Free
Free
- 7
Hidden Object : Hollywood Crime
$1.99
- 8
Nuclear Warfare
Free
- 9
Funtoon's World HD
Free
- 10
Debonair
Free